Source Characteristics of the Mw 4.3 and Mw 4.4 central San José Earthquakes Derived from Empirical Green’s Functions
Aaron Moya (https://orcid.org/0009-0008-8834-4954)
(1)
Laboratorio
de Ingeniería Sísmica, Universidad de Costa Rica, Costa Rica
Article history: received Month DD, YYYY; accepted Month DD, YYYY
Abstract
We investigated the source characteristics of the August 22, 2025 (Mw 4.3) and January 19, 2026 (Mw 4.4) San José earthquakes. Although moderate in magnitude, both events occurred at a shallow depth (~4.0 km) beneath the central urban area of the capital city. They produced strong ground shaking with peak ground accelerations reaching approximately 230 gal. Using small aftershocks as Empirical Green’s function (EGFs), we estimated the size of the strong-motion generation areas (SMGAs), rise time, rupture velocity, and associated stress drop for each event. Despite their similar magnitudes, the two earthquakes exhibit notable differences in SMGA size and stress drop, which appear to control the spatial distribution of observed acceleration.
Keywords: strong motion generation area; fault; accelerograph; earthquake; stress drop
Urban areas located in tectonically active regions face a particular risk from earthquakes due to high population density and concentration of critical infrastructure. Understanding seismic hazard in such environments is therefore essential for effective risk mitigation and urban planning, particularly where active faults are poorly expressed at the surface or remain insufficiently studied. The capital city of Costa Rica, San José, is of particular interest in this sense because the urban development has often outpaced detailed seismotectonic investigations (Peraldo and Montero, 1999; Climent et al., 2008).
Although the country lies within a highly active tectonic setting controlled by the interaction of the Cocos, Caribbean, and Panama microplates, no major active faults have been clearly identified directly beneath San José, or they remain poorly constrained (Fernández & Montero, 2002). Nevertheless, historical and instrumental seismicity demonstrates that the Greater Metropolitan Area (GAM) is exposed to significant earthquake hazard (Hidalgo-Leiva et al., 2022; Benito et al., 2025).
Historical seismicity reveals the potential consequences of earthquakes in the GAM. The most damaging event was the Ms 6.4 Cartago earthquaka of May 4, 1910 (IMM VIII). It devastated the city of Cartago, located approximately 20 km east of San José. Intensity studies and historical accounts indicate near-total destruction of the city and approximately 700 fatalities, making it the most disastrous earthquake in Costa Rican history (Montero & Miyamura, 1981; Peraldo & Montero, 1999; Alonso-Henar et al., 2013). This event serves as a clear reminder of the catastrophic impact that a shallow crustal earthquake can have on urban centers.
F
igure
1.
Seismicity
recorded in central San José, Costa Rica from August, 2025 until
January, 2026. The map shows the epicentral locations of the two
significant events: the August 22, 2025 (Mw 4.3) (blue star) and the
January 19, 2026 (Mw 4.4) (green star). The yellow circle shows the
August 22, 2025 Mw 2.8 event used as empirical Green’s function
(EGF). Orange circles correspond to recorded aftershocks. Gray lines
correspond to mayor roads. Focal mechanism solutions indicate a
predominance of left-lateral strike-slip faulting. Black triangles
show the location of the strong motion stations used in this study.
SHTH and SLMA were not part of the EGF analysis. The inset map
highlights the study area within Costa Rica..
The most recent Mw 6.1–6.2 Cinchona earthquake of January 8, 2009, located approximately 30–40 km north-northwest of San José (Barquero, 2009) shook San José violently. A station located some 13-14 km away from the epicenter recorded a value of 658 gals and 26.5 cm/s. This shallow, oblique-slip event generated strong ground shaking and extensive landslides, particularly on the steep volcanic slopes near the epicentral area (Quesada-Román & Barrantes-Castillo, 2016). Estimates from the Comisión Nacional de Emergencias (CNE) and national media indicate around 25–27 confirmed deaths, at least five missing, and approximately 100 injured, with hundreds of people displaced or sheltering in emergency accommodations after structural failures and slope collapses blocked access routes and damaged homes. More than 2,300 structures were damaged, with nearly 800 destroyed.
In this context, the earthquakes that took place on August 22, 2025 and January 19, 2026, directly beneath the city of San José, provide a particularly informative case study (Fig. 1). The Laboratorio de Ingeniería Sísmica at the Universidad de Costa Rica (LISUCR) estimated the magnitudes as Mw 4.3 and Mw 4.4 for the first and second events, respectively. The Red Sismológica Nacional (RSN, Universidad de Costa Rica) reported slightly higher magnitudes of Mw 4.4 and Mw 4.5, while the Observatorio Vulcanológico y Sismológico de Costa Rica (OVSICORI-UNA, Universidad Nacional) estimated their magnitude as Ml 4.1 and Ml 4.4 respectively. Despite the small differences, all three institutions consistently indicated that the first event was smaller than the second one.
Those events and some of their aftershocks were recorded by a dense strong-motion network deployed by the LISUCR across the city (Fig. 1). This allowed for high-resolution observations of near-source ground motions close to the source area. Despite their moderate magnitude, each earthquake produced notable peak ground accelerations (PGA) and velocities (PGV) throughout the GAM as shown in Figure 2. The largest PGA and PGV values are systematically observed at stations located east of the epicenter.
In this analysis, we apply an empirical Green’s function (EGF) approach using a nearby small aftershock, Mw 2.8, with similar focal mechanism and hypocentral location as the M4+ events (Fig. 1). The focal mechanism was determined by the LISUCR using the P-wave polarities and the method proposed by Hardebeck & Shearer (2002). The use EGF method allows for the removal of the unknown path and site effects from the observed waveforms, thereby isolating the source time function and rupture characteristics of the main event such as the stress drop, rupture velocity, and rise time.
F
igure
2.
Maximum
acceleration and velocity values recorded for the Mw 4.3 and Mw 4.4
events. The data are ordered from West to East by station code. The
values highlight the spatial distribution relative to the hypocenter
located between stations STRN and SION.
2. Data and Methods
2.1 Strong Motion Data
The LISUCR maintains a nationwide network of strong-motion instruments that provide continuous records of ground motion from moderate to large earthquakes (Moya et al., 2020). These instruments are located at a variety of sites, and within the GAM there are several dozen stations, including installations in high-rise buildings. Figure 3 shows the distribution of the strong-motion stations throught the country. The dashed black rectangle shows the study area in Figure 1.
The network comprises a combination of force-balance accelerometers (FBA) and micro-electromechanical system (MEMS) sensors. FBA sensors are characterized by a wide dynamic range and low self-noise, which allow for reliable integration of acceleration records to velocity and displacement. In contrast, although MEMS sensors provide a cost-effective solution for dense urban deployments and perform adequately for moderate to large ground motions, their higher noise levels limit their ability to accurately capture low-amplitude signals from small events.
For this reason, only stations equipped with FBA sensors were considered in this study. In particular, the SHTH and SLMA stations (highlighted in black in Fig. 1) were excluded from the analysis, as their records exhibit significant noise amplification upon double integration, resulting in unstable and unreliable displacement time series.
2.2 EGF selection
Several aftershocks were evaluated as potential empirical Green’s functions (EGFs), as summarized in Table 1. The selection process considered the magnitude, hypocentral proximity to the mainshocks, focal mechanism, and finally, the waveform amplitudes at the selected stations. Table 1 reports the magnitude, depth, and peak ground acceleration (PGA) values at each station. Among the candidates, EGF #8 and #9 were discarded due to missing records at several sites, while EGF #3 (Mw 3.5) was considered too large in source dimension for the events being simulated.
The smallest candidates (EGF #1, #4, and #7) exhibited low PGAs at multiple stations, which compromises their reliability as stable Green’s functions, particularly when the waveforms are double-integrated to derive displacement and at more distant stations such as SCNE and SBEB. EGF #2 (Mw 2.8, Depth 3.9 km) was the only candidate with PGA values exceeding 1.5 gals at all stations in addition to being located in the middle of the two mainshocks (Fig. 1).
Table 1. Magnitude, depth (in km) and horizontal PGA values (in gals) at given stations for EGF candidates.
Candidate EGF |
Mw |
Depth |
SBEB |
SCNE |
SION |
SMOR |
SSBN |
STRN |
SUNL |
SUN6 |
SUN7 |
1 |
2.6 |
5.0 |
2.37 |
0.72 |
1.41 |
0.90 |
0.79 |
0.70 |
1.32 |
2.02 |
1.80 |
2 |
2.8 |
3.9 |
3.04 |
1.51 |
2.21 |
1.91 |
2.55 |
1.50 |
5.45 |
3.03 |
2.98 |
3 |
3.5 |
3.9 |
10.47 |
7.20 |
12.10 |
7.81 |
12.52 |
6.34 |
8.77 |
7.86 |
8.77 |
4 |
2.6 |
4.4 |
2.77 |
0.91 |
2.38 |
0.64 |
1.17 |
0.75 |
0.76 |
0.85 |
0.45 |
5 |
2.8 |
3.1 |
1.53 |
1.18 |
2.23 |
1.09 |
1.60 |
1.06 |
0.75 |
1.11 |
1.24 |
6 |
2.7 |
5.5 |
1.60 |
1.12 |
0.80 |
0.91 |
0.80 |
0.42 |
2.50 |
2.53 |
1.73 |
7 |
2.4 |
5.2 |
3.06 |
0.94 |
0.71 |
0.91 |
1.03 |
0.38 |
1.48 |
1.65 |
1.17 |
8 |
2.9 |
4.1 |
4.42 |
- - - - |
5.58 |
4.37 |
2.60 |
- - - - |
2.31 |
2.15 |
6.54 |
9 |
3.5 |
3.6 |
6.45 |
12.31 |
21.50 |
- - - - |
9.12 |
- - - - |
21.67 |
- - - - |
24.60 |
We also evaluated the signal-to-noise ratio (SNR) for EGF #2 and the mainshocks. The SNR was calculated as the ratio of the root-mean-square (RMS) amplitude within the signal window to that within a pre-event or post-event noise window. For this analysis, a 10-second window was used. Prior to calculation, all waveforms were detrended, demeaned, and bandpass filtered between 0.1 and 10 Hz. The resulting SNR values for each station are listed in Table 2.
Table 2. Signal to noise ratio (SNR) for selected events at each station.
Event |
SBEB |
SCNE |
SION |
SMOR |
SSBN |
STRN |
SUN6 |
SUN7 |
SUNL |
Mw 2.8 |
72.5 |
109.0 |
44.8 |
65.8 |
83.9 |
51.8 |
195.9 |
117.8 |
115.3 |
Mw 4.3 |
63.8 |
76.7 |
54.2 |
77.5 |
69.4 |
58.2 |
110.4 |
134.9 |
164.2 |
Mw 4.4 |
41.8 |
46.3 |
45.5 |
48.0 |
42.6 |
44.5 |
70.3 |
66.1 |
63.2 |
For the Mw 2.8 event selected as the EGF, the peak ground accelerations (PGA) and peak ground velocities (PGV) show notable variations across stations as shown by Table 3. The eastern stations (SUN6, SUN7, SUNL) exhibit significantly higher PGA and PGV values—8.14, 2.98, and 5.45 cm/s² for PGA, and 0.11, 0.07, and 0.12 cm/s for PGV—compared to western and central stations, where PGA values range from 1.5 to 3.03 cm/s² and PGV from 0.02 to 0.05 cm/s. This enhancement at eastern sites could be indicative of apparent directivity effects or the elevated values could reflect local site amplification.
Because of the relatively small amplitude of the velocity waveforms, the corresponding displacement (PGD), obtained through double integration, would be even smaller and therefore more susceptible to low-frequency noise and baseline errors. To mitigate these effects and ensure stable and reliable time series in the EGF analysis, the frequency band between 0.3 and 10 Hz was used. This frequency range suppresses long-period noise while preserves the signal content relevant for the analysis.
Table 3. PGA and PGV values for Mw 2.8 event.
Mw 2.8 |
SBEB |
SCNE |
SION |
SMOR |
SSBN |
STRN |
SUN6 |
SUN7 |
SUNL |
PGA (cm/s2) |
3.03 |
1.51 |
2.21 |
1.91 |
2.5 |
1.50 |
8.14 |
2.98 |
5.45 |
PGV (cm/s) |
0.02 |
0.02 |
0.03 |
0.05 |
0.04 |
0.02 |
0.11 |
0.07 |
0.12 |
F igure
3.
Strong
motion station distribution throught Costa Rica. The dashed black box
corresponds to the study area shown in Fig 1. Dashed light gray lines
correspond to administrative divisions.
igure
3.
Strong
motion station distribution throught Costa Rica. The dashed black box
corresponds to the study area shown in Fig 1. Dashed light gray lines
correspond to administrative divisions.
2.3 Focal mechanism and source parameters
Focal mechanisms were determined using the HASH algorithm (Hardebeck & Shearer, 2002) based on first-motion polarity data. The Mw 2.8 event was constrained by 28 polarity observations, the Mw 4.3 event by 23 polarities, and the Mw 4.4 event by 30 polarities. The station distribution provides generally good azimuthal coverage as shown by Figure 3 with values of 0.928, 0.876, and 0.978 for the Mw 2.8, Mw 4.3 and, Mw 4.4 events (a value of 1 represents perfect station coverage). The preferred focal mechanism solutions are characterized by low polarity misfit, with values of 6.3%, 4.2%, and 11.3% for the Mw 2.8, Mw 4.3, and Mw 4.4 events, respectively. The corresponding HASH quality grades are B, A, and B which indicate moderate to well-constrained solutions for the purpose of the present study.
Earthquake locations were determined using the non-linear location algorithm NonLinLoc (Lomax et al., 2000). The uncertainties were quantified by the 68% confidence ellipsoids. For the Mw 2.8 event, the semi-major, intermediate, and minor axes of the confidence ellipsoid are 0.97 km, 0.54 km, and 0.55 km, respectively. For the Mw 4.3 event, the corresponding values are 0.77 km, 0.53 km, and 0.42 km, and for the Mw 4.4 event they are 0.80 km, 0.49 km, and 0.53 km. These results indicate that location uncertainties are generally on the order of ~0.4–1.0 km which are small relative to the spatial separation between the events and the stations.
Moment magnitude (Mw) was estimated from low-frequency displacement amplitude spectra following the procedure described in Moya (2024). Spectra were computed for multiple stations, and Mw was obtained from the average spectral level in the low-frequency plateau.
Figure 4 shows the observed displacement, velocity, and acceleration waveforms for the Mw 4.3 (blue trace) and the Mw 4.4 (green trace) events. For both earthquakes, the waveforms exhibit clear, impulsive onsets across the network, indicating good signal quality at the selected FBA stations. In the Mw 4.3 event, the observed displacement records are characterized by relatively small peak amplitudes and short signal durations, with most of the energy concentrated within the first few seconds following the initial arrival. The corresponding velocity waveforms show well-defined pulses with peak values generally below a few cm/s, while acceleration records display sharp, high-frequency content with distinct peaks and rapid decays. PGA values range from approximately 30–40 cm/s² at western stations such as SBEB and SCNE to more than 200–230 cm/s² at eastern stations including SUN6, SUN7, and SUNL.
F
igure
4.
Observed
displacement, velocity, and acceleration waveforms for the Mw 4.3
(blue) and Mw 4.4 (green) events.
Waveforms from the Mw 4.4 event display broadly similar characteristics, although displacement records show slightly longer durations and have larger peak amplitudes at several stations (e.g., SUNL, SCNE and SION). Despite the slightly larger magnitude of this event and its closer proximity to several eastern stations, the observed PGA and PGV values are not consistently larger than those of the Mw 4.3 earthquake.
Peak ground motion measurements summarized in Figure 2 reveal a pronounced azimuthal dependence in shaking intensity for both events. Stations located east of the epicenter record systematically larger PGA and PGV values than stations at comparable distances to the west, whereas western and more distant stations (e.g., SBEB and SCNE) show lower amplitudes and smoother waveform shapes. This spatial pattern is consistent across both mainshocks and is evident in both acceleration and velocity observations.
Normalizing peak ground motions by distance further emphasizes this azimuthal asymmetry (Fig. 5). Eastern stations (azimuths 60–120) exhibit PGA/R and PGV/R values that are 5–10 times larger than those observed at western stations (azimuths 240–300).
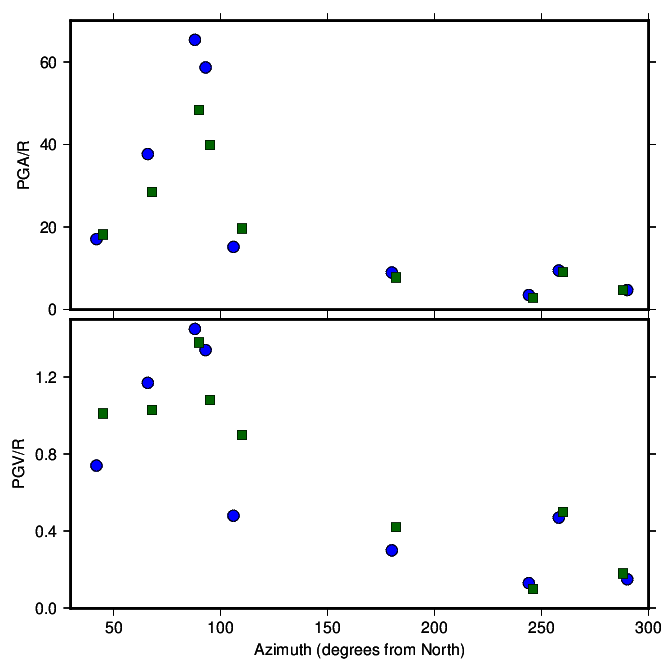
Figure 5. Normalized PGA and PGV values with respect to hypocentral distance, R, as a function of azimuth from north. Mw 4.3 is shown as blue circles, Mw 4.4 is shown as green squares.
The strong similarity of observed waveforms across the network suggests that the two earthquakes likely ruptured the same fault or fault segment, consistent with their similar focal mechanisms and hypocentral locations (Fig. 1. and Table 4). At the same time, systematic differences in amplitude, duration, and relative peak ground motions imply that the rupture processes were not identical, potentially reflecting variations related to the rupture processes.
Table 4. Location and source parameters for the three events used in the EGF analysis
|
Element event |
Mw 4.3 |
Mw 4.4 |
Date |
2025-08-22 09:21:59 |
2025-08-22 06:45:37 |
2026-01-19 23:06:56 |
Magnitude (Mw) |
2.8 |
4.3 |
4.4 |
Depth (km) |
3.9 |
4.0 |
4.0 |
Longitude / Latitude |
-84.076 / 9.935 |
-84.076 / 9.939 |
-84.072 / 9.936 |
Strike / Dip / Slip |
51 / 56 / -20 |
86 / 70 / -15 |
76 / 62 / -17 |
2.2 Empirical Green’s Function Method
The empirical Green’s function method relies on the assumption that the records from smaller events can be used to reconstruct a larger one as far as they both share similar focal mechanism and hypocentral locations. The rupture process is represented by a finite number of subfaults, N, that corresponds to what Miyake et al. (2003) describe as a strong motion generation area (SMGA). A SMGA is a localized portion of the fault plane that radiates high-frequency seismic energy and controls the generation of near-field strong ground motions. It is characterized by relatively large slip, short rise time, and high stress drop compared to the surrounding rupture area.
Irikura (1986) assumed an omega-squared model (Brune, 1970) to reconstruct the main event (“Mw 4.3” and “Mw 4.4” in Table 4), U(t), as the summation of a smaller event (the “Element event” in Table 4), u(t), distributed along a given number of subfaults, N. In his formulation, the waveform U(t) can be expressed as follows,
 (1)
(1)
 (2)
(2)
 (3)
(3)
where
 is the ground-motion from the element event,
 ,
,
 ,
and
,
and
 are
the corresponding distances from the site to the hypocenter, the site
to the (i,j)
subfault and from the site to the rupture starting point on the fault
plane (Fig. 6).
are
the corresponding distances from the site to the hypocenter, the site
to the (i,j)
subfault and from the site to the rupture starting point on the fault
plane (Fig. 6).
 corresponds to the distance between the starting point and the (i,j)
subfault,
corresponds to the distance between the starting point and the (i,j)
subfault,
 is the S-wave velocity,
 is the rupture velocity,
 is the riste time of the target event,
 is the stress drop ratio between the target and element event, and
 is an arbitrary integer number used to shift the artificial
periodicity to a frequency higher than that of interest. The asterisk
in (1) denotes convolution in the time domain.
is an arbitrary integer number used to shift the artificial
periodicity to a frequency higher than that of interest. The asterisk
in (1) denotes convolution in the time domain.
From the spectral ratio between the observed records from the large and small event, Miyake et al. (2003) proposed thee following equation for fitting a theoretical source model such that,
 (4)
(4)
where
 and
and
 correspond to the corner frequency of the large and small magnitude
event respectively. If
correspond to the corner frequency of the large and small magnitude
event respectively. If
 then
then
 (5)
(5)
and
when

 (6)
(6)
Then, the N and C constants can be obtained as,
 (7)
(7)
 (8)
(8)
For
each station, the Fourier amplitude spectrum was calculated. We
assumed an S-wave velocity, Vs,
of 3.2 km/s and corrected the records by geometrical spreading and
quality factor
 (Chavarría et al., 2023). We took the vectorial summation
 of the horizontal compoents, NS(f)
and EW(f).
The spectral ratios (Fig. 7) were then computed and a theoretical
omega-squared model was fitted to the data using equation 4. The
corner frequencies estimated from spectral ratios are very similar
(8.1 and 7.8 Hz), justifying the use of a common EGF to better
isolate source effects (e.g., Wen et al., 2014). Given the small size
of the element event, we assumed that the width (w)
and length (l)
(Fig. 6) were equal, such that w=l=dx.
Using the Brune (1970) circular crack model and a corner frequency of
~8
Hz, the source radius was calculated as
of the horizontal compoents, NS(f)
and EW(f).
The spectral ratios (Fig. 7) were then computed and a theoretical
omega-squared model was fitted to the data using equation 4. The
corner frequencies estimated from spectral ratios are very similar
(8.1 and 7.8 Hz), justifying the use of a common EGF to better
isolate source effects (e.g., Wen et al., 2014). Given the small size
of the element event, we assumed that the width (w)
and length (l)
(Fig. 6) were equal, such that w=l=dx.
Using the Brune (1970) circular crack model and a corner frequency of
~8
Hz, the source radius was calculated as
 (9)
(9)
The
corresponding
 =
0.26 km, where
=
0.26 km, where
 .
Using
equation 7 and 8, we obtained N=3 and C=5.3 for the Mw 4.3 event and
N=4 and C=3.2 for the Mw 4.4 event.
.
Using
equation 7 and 8, we obtained N=3 and C=5.3 for the Mw 4.3 event and
N=4 and C=3.2 for the Mw 4.4 event.
A grid-search approach was implemented to determine the optimal rupture initiation point for each strong motion generation area (SMGA). The search range for the rupture initiation point was 1–3 for the Mw 4.3 event and 1–4 for the Mw 4.4 event. Additionally, rise time was explored within the range 0.01–0.1 s, and rupture velocity, Vr, was varied between 70% and 90% of the shear-wave velocity (Vs). Table 5 summarizes the parameter ranges considered in the analysis.
Table 5. Fixed and searched parameters for EGF analysis
Parameter |
Mw 4.3 |
Mw 4.4 |
dx |
0.26 km |
0.26 km |
N |
3x3 |
4x4 |
C |
5.3 |
3.2 |
Rise time |
0.01 – 0.1 s |
|
Vr |
0.7Vs – 0.9Vs |
|

Figure 6. Schematic representation of the empirical Green’s function method by Irikura (1986).
F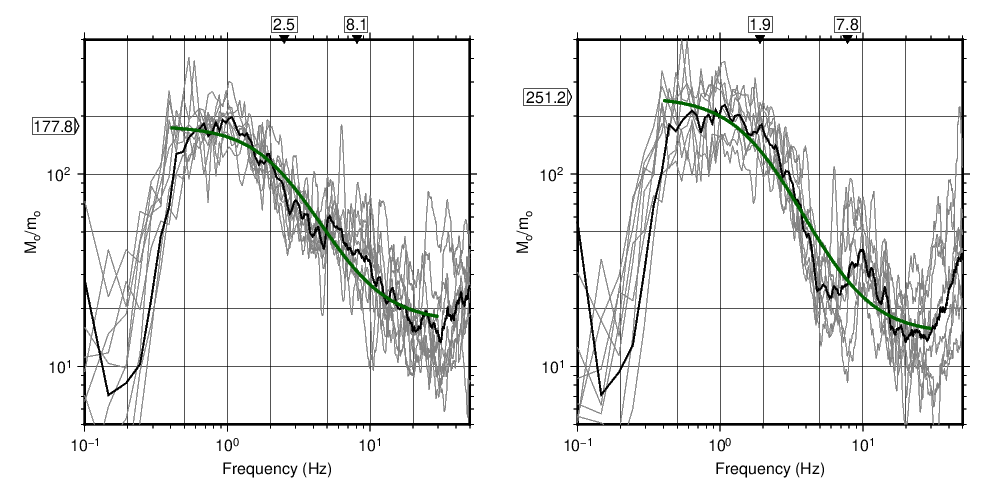 igure
7.
Single
spectral ratios between the Mw 4.3 / Mw 2.8 (left) and Mw 4.4 / Mw
2.8 (right) events at the recording sites (gray lines). The
corresponding corner frequencies are shown on top and the ratio
between their seismic moments,
igure
7.
Single
spectral ratios between the Mw 4.3 / Mw 2.8 (left) and Mw 4.4 / Mw
2.8 (right) events at the recording sites (gray lines). The
corresponding corner frequencies are shown on top and the ratio
between their seismic moments,
 ,
on the left. The thick black line corresponds to the average and the
green line to the least-squares fitting following equation 4.
,
on the left. The thick black line corresponds to the average and the
green line to the least-squares fitting following equation 4.
3.1 Waveform fitting
The observed (black) and synthetic (red) displacement, velocity, and acceleration waveforms for the Mw 4.3 and Mw 4.4 events are shown in Figure 8 and 9. The quality of the fitting varies among stations and between components. Several stations show agreement in both phase and amplitude, while others show minor discrepancies specially in the later portions of the waveforms, where the synthetics tend to under- or over-estimate secondary arrivals and coda amplitude (in particular at NS component for SUN6 in displacement and SCNE and SBEB). Component-dependent differences are also evident. Figure 10 shows how well the PGA, PGV, and PGD observed values adjust with the synthetic ones. In both events, the EW component seems to be the one with better fits.
The
element event’s (Mw 2.8) seismic moment was calcualted as 2.0E13
N-m; its corresponding stress drop was
 MPa.
The SMGA’s seismic moment was computed as
MPa.
The SMGA’s seismic moment was computed as
 and
the stress drop as
and
the stress drop as
 .
Table 6
summarizes the parameters
obtained from the grid-search approach
for each earthquake. They indicate that the rupture processes were
not identical even though the events magnitude and location were very
similar.
.
Table 6
summarizes the parameters
obtained from the grid-search approach
for each earthquake. They indicate that the rupture processes were
not identical even though the events magnitude and location were very
similar.
For the Mw 4.3 event, the relatively small SMGA area (0.61 km²), short rise time (0.06 s), and high stress drop (14.7 MPa) could be responsible for the impulsive character and strong high-frequency content of the observed acceleration records. The rupture initiation point at position (1,3), located toward the western portion of the SMGA (Fig. 11), could result in a rupture geometry that enhanced seismic radiation toward the east. This would explain the larger observed PGA and PGV values at eastern stations such as SUN6, SUN7, and SUNL, although peak amplitudes are slightly underestimated at the closest eastern stations, such as SION.
Table 6. Source parameters from the EGF determination.
|
Mw 4.3 |
Mw 4.4 |
SMGA (km2) |
0.61 |
1.08 |
Number of sufaults |
3x3 |
4x4 |
Rupture starting point |
( 1 , 3 ) |
( 2 , 4 ) |
Rise time (s) |
0.06 |
0.08 |
Seismic moment of SMGA (N-m) |
2.86E15 (Mw 4.3) |
4.61E15 (Mw 4.4) |
Rupture velocity (km/s) |
2.24 (70% of Vs) |
2.85 (89% of Vs) |
Stress drop (MPa) |
14.70 |
9.98 |
On the contrary, the Mw 4.4 event has larger SMGA (1.08 km²), longer rise time (0.08 s), and lower stress drop (9.98 MPa) that could lead to waveforms with slightly longer durations and smoother envelopes which are observed in displacement and velocity records. The rupture initiation point at (2,4) is deeper and slightly shifted (Fig. 11) compared to that of the Mw 4.3 event. This could result in a different rupture propagation pattern within the SMGA that could produce subtle but systematic differences in waveform amplitude and timing, particularly at intermediate and eastern stations.
F
igure
8.
Waveform
fitting between observed (black) and synthetic (red) data for both
horizontal components in displacement, velocity, and acceleration for
event Mw 4.3.
F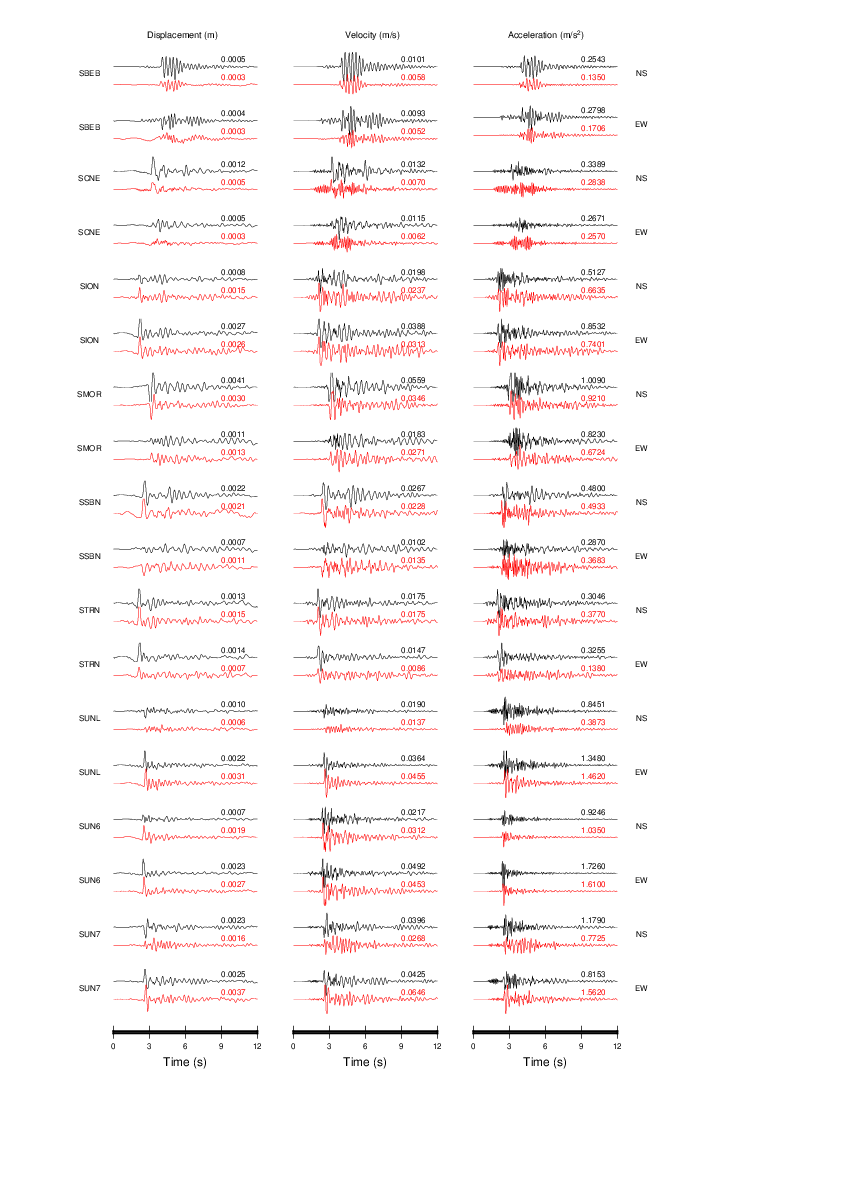
igure
9.
Waveform
fitting between observed (black) and synthetic (red) data for both
horizontal components in displacement, velocity, and acceleration for
event Mw 4.4.
3.2 Stress drop
Stress drop estimates for small to moderate earthquakes are commonly derived from spectral corner frequencies using circular crack models. Although these estimates exhibit wide variability, typical stress drop values for crustal earthquakes with magnitudes of approximately M3 – M4 generally cluster below ~10 MPa. For example, a spectral study of shallow earthquakes in Western Europe by Yen et al. (2024) reported a mean stress drop of ~8.6 MPa for events with M > 3, while Bora (2017) found median values of ~5.6–5.8 MPa for shallow crustal earthquakes in the same region. Similarly, Hardebeck and Aron (2009) reported a median stress drop of ~8.7 MPa for M1.0 – M4.2 earthquakes along the Hayward Fault in California.
F igure
10.
Comparison
between observed vs synthetic peak ground displacement, velocity, and
acceleration values for the Mw 4.3 (blue circles) and Mw 4.4 (green
circles) events.
igure
10.
Comparison
between observed vs synthetic peak ground displacement, velocity, and
acceleration values for the Mw 4.3 (blue circles) and Mw 4.4 (green
circles) events.
In contrast, the stress drops estimated in this study correspond to the SMGAs. As such, they represent effective stress drops associated with the high-slip, high-radiation portions of the rupture and are expected to be higher than stress drops inferred from whole-source models. Previous studies have shown that SMGA or asperity-based stress drops commonly exceed spectral estimates because they emphasize localized regions of concentrated slip and energy release (e.g., Miyake et al., 2003; Asano & Iwata, 2012). Within this context, the relatively high stress drop of the Mw 4.3 event (~14.7 MPa) is physically reasonable and consistent with the observed impulsive waveforms, whereas the lower stress drop of the Mw 4.4 event (~9.98 MPa), combined with its larger SMGA and longer rise time, probably explain the lower PGA and PGV values compared to the Mw 4.3 event.
F igure
11.
Schematic
representation of the SMGAs for the (a) Mw 4.3 and (b) Mw 4.4
earthquakes. The rupture starting point is highlighted in yellow for
both events. It is (1,3) for the first one and (2,4) for the second
one. The two earthquakes are located slightly east of STRN station.
igure
11.
Schematic
representation of the SMGAs for the (a) Mw 4.3 and (b) Mw 4.4
earthquakes. The rupture starting point is highlighted in yellow for
both events. It is (1,3) for the first one and (2,4) for the second
one. The two earthquakes are located slightly east of STRN station.
Wen et al. (2014) showed that two closely spaced blind-thrust earthquakes in the 2013 Nantou sequence, Taiwan, despite similar magnitudes and focal mechanisms, exhibited distinct strong-motion characteristics associated with different SMGA stress drops (~14 MPa and ~9 MPa). Likewise, Somei et al. (2024) demonstrated for the 2018 Northern Osaka Prefecture earthquake that relatively high SMGA stress drops (~14–15 MPa) and rupture propagation within the SMGA were essential to reproducing observed azimuthal variations in PGA and PGV. This implies that even closely located earthquakes with different stress drops on a similar fault may generate different strong-motion patterns when their SMGA properties differ.
4. CONCLUSIONS
The following conclusions summarize the key findings from this study.
1. The Mw 4.3 and Mw 4.4 earthquakes were likely generated on the same fault or fault segment, as indicated by their similar focal mechanisms, hypocentral locations, and highly coherent observed waveforms from all stations that recorded the events. However, differences in rupture parameters obtained from the simulations confirm that their rupture processes were not identical.
2. Variations in waveform fittings, particularly in later phases and coda, suggest that local site effects, small-scale rupture heterogeneities, and limitations of the simplified source model could contribute to discrepancies between observed and synthetic records.
3. Source-related parameters—specifically SMGA size, stress drop, rise time, and rupture initiation location—appear to influence the amplitude, frequency content, and duration of the simulated ground motions for both events. The Mw 4.3 event is associated with a smaller SMGA, shorter rise time, and a somewhat higher estimated stress drop, whereas the Mw 4.4 event exhibits a larger SMGA, longer rise time, and a lower estimated stress drop. However, it is important to consider that stress-drop estimates are sensitive to factors such as data quality, modeling assumptions, source parameterization, and possible structural effects. Moreover, the difference between the estimated values (on the order of ~14 MPa versus ~10 MPa) may not be statistically significant, given typical uncertainties that can reach up to a factor of two.
4. A pronounced eastward amplification of ground motion is observed for both events, with PGA increasing significantly from western to eastern stations. Distance-normalized ground-motion measures confirm that this pattern is primarily source-driven rather than a result of attenuation or path effects. Also, despite the larger seismic moment of the second event, it does not systematically generate larger PGA or PGV values, probably highlighting the importance of stress drop and rupture geometry over moment alone.
5. Western stations show relatively uniform distance-normalized PGA and PGV values between the two events, suggesting more homogeneous radiation and attenuation. In contrast, eastern stations display greater variability, which may reflect directional source effects and differences in SMGA radiation.
6. The elevated SMGA stress drops estimated in this study are physically reasonable and consistent with previous asperity-based studies, reinforcing that effective stress drops associated with high-slip regions can exceed whole-source spectral estimates.
7. The occurrence of two moderate-magnitude earthquakes beneath a densely populated urban area, producing strong spatial variability in ground motion over short distances, underscores the need to incorporate source complexity and rupture directivity into seismic hazard assessments, even for moderate events.
Data availability statement. Strong motion data is available at https://crsmd.lis.ucr.ac.cr/. A program of the empirical Green's function method by Irikura (1986) can be provided upon request to the author.
Acknowledgments. Strong motion data for the 2025-2026 events was collected and maintained by technical stuff from LISUCR Luis Navarro and Gustavo Poveda.
Alonso-Henar, J., Montero, W., Martínez-Díaz, JJ, and Alvarez-Gómez, JA. (2013). The Aguacaliente fault, source of the Cartago 1910 destructive earthquake (Costa Rica). Terra Nova, 25(5), 368-373. https://doi.org/10.1111/ter.12045.
Asano, K., Iwata, T. (2012). Source model for strong ground motion generation in the frequency range 0.1–10 Hz during the 2011 Tohoku earthquake. Earth Planets Space, 64, 1111–1123. https://doi.org/10.5047/eps.2012.05.003.
Barquero, R. (2009). El terremoto de Cinchona del jueves 8 de enero de 2009. Rev. Geol. Am. Cent., 40, 91–95. https://doi.org/10.15517/rgac.v0i40.4188.
Benito, M.B., Arroyo-Solórzano, M., Climent, Á., Montero, W., Alvarado, G.E., López, A., García-Lanchares, C., Marchamalo, M., Ornelas, A., Hernández-Rubio, O., Quirós, L. (2025). Seismic hazard scenarios for the city of San José, Costa Rica: Evaluation of critical ruptures on nearby faults. Earthq. Spectra, 2025, 41(3), 2335–2370. https://doi.org/10.1177/87552930251319736.
Bora, S.S., Cotton, F., Scherbaum, F., et al. (2017). Stochastic source, path and site attenuation parameters and associated variabilities for shallow crustal European earthquakes. Bull. Earthq. Eng., 2017, 15, 4531–4561. https://doi.org/10.1007/s10518-017-0167-x.
Brune, J.N. (1970). Tectonic stress and the spectra of seismic shear waves from earthquakes. J. Geophys. Res., 75, 4997–5009.
Chavarría, N., Yokoi, T., Hayashida, T. (2023). Strong motion estimation in Costa Rica at non-record sites using spectral inversion method. J. Seismol., 27, 305–324. https://doi.org/10.1007/s10950-023-10137-9.
Climent, Á., Rojas, W., Alvarado, G. E. y Benito, B. (2008). Proyecto Resis II: Evaluación de la amenaza sísmica en Costa Rica. UPM, NOR- SAR, San José, Costa Rica., https://rsn.ucr.ac.cr/images/Biblioteca/Informes_sismos/amenaza_Sísmica_cr.pdf. Accessed 05 Feb 2026.
Fernández, M., Montero, W. (2002). Fallamiento y sismicidad del área entre Cartago y San José, Valle Central de Costa Rica. Rev. Geol. Am. Cent., 2002, 26, 25–37. https://doi.org/10.15517/rgac.v0i26.8528.
Hardebeck, J.L., Aron, A. (2009). Earthquake stress drops and inferred fault strength on the Hayward Fault, East San Francisco Bay, California. Bull. Seismol. Soc. Am.,99,1801–1814. https://doi.org/10.1785/0120080242.
Hardebeck, J.L., Shearer, P.M. (2002). A new method for determining first-motion focal mechanisms. Bull. Seismol. Soc. Am., 92(6), 2264–2276. https://doi.org/10.1785/0120010200.
Hidalgo-Leiva, D., Linkimer, L., Arroyo, I., Arroyo-Solórzano, M., et al. (2022). The 2022 seismic hazard model for Costa Rica. Bull. Seismol. Soc. Am., 113(1), 23–40. https://doi.org/10.1785/0120220119.
Irikura, K. (1986). Prediction of strong acceleration motion using empirical Green’s function. In: Proc. 7th Japan Earthquake Engineering Symposium, Tokyo, pp. 151–156.
Lomax, A., J. Virieux, P. Volant and C. Berge-Thierry. Probabilistic Earthquake Location in 3D and Layered Models. In: Thurber C.H., Rabinowitz N. (eds) (2000). Advances in Seismic Event Location, Modern Approaches in Geophysics, 18, Springer, Dordrecht, doi:10.1007/978-94-015-9536-0_5.
Miyake, H., Iwata, T., Irikura, K. (2003). Source characterization for broadband ground-motion simulation: Kinematic heterogeneous source model and strong motion generation area. Bull. Seismol. Soc. Am. , 93, 2531–2545. https://doi.org/10.1785/0120020183.
Montero, W., Miyamura, S. (1981). Distribución de intensidades y estimación de los parámetros focales de los terremotos de Cartago de 1910, Costa Rica, América Central. Inf. Sem. IGN , 1981, (2), 9–34.
Moya, A., Pinzón, L.A., Schmidt-Díaz, V., Hidalgo-Leiva, D., Beneit, L. (2020). A strong-motion database of Costa Rica: 20 years of digital records. Seismol. Res. Lett. ,2020, 91, 3407–3416. https://doi.org/10.1785/0220200036.
Moya, Aaron. (2024). The MASLIS: A five-year review of Costa Rica's near real-time seismic intensity processing system. Annals of Geophysics. 67. S552. 10.4401/ag-9137.
OVSICORI-UNA, Reporte de actividad sísmica: Estudio preliminar de la actividad sísmica en el centro de San José entre agosto de 2025 y enero de 2026. https://www.ovsicori.una.ac.cr/index.php/sismologia/informes-y-boletines/boletines-sismologia?download=1295:reporte-de-actividad-Sísmica-estudio-preliminar-de-la-actividad-Sísmica-en-el-centro-de-san-José-entre-agosto-de-2025-y-enero-de-2026 , Accessed 05 Feb 2026.
Peraldo, G., Montero, W. (1999). Sismología histórica de América Central. Instituto Panamericano de Geografía e Historia–UCR, 348 pp.
Quesada Román, A., Barrantes Castillo, G. (2016). Procesos de ladera cosísmicos del terremoto de Cinchona (Costa Rica) del 8 de enero de 2009 (Ms = 6.2). Cuad. Geogr. , 25(1), 217–232.
RSN, Sismos en San José, enero de 2026. https://rsn.ucr.ac.cr/index.php/actividad-Sísmica/reportes-sismicos/sismo-en-san-José-19-de-enero-de-2026, Accessed 05 Feb 2026.
Somei, K., Guo, Y., Yoshida, K., Akazawa, T., Nishimura, T., Miyakoshi, K., Irikura, K. (2024). Reproductions of strong ground motions during the 2018 Northern Osaka Prefecture earthquake using the empirical Green’s function method. Jpn. Geotech. Soc. Spec. Publ., 10 (60), 2465–2468. https://doi.org/10.3208/jgssp.v10.P2-22
U.S. Geological Survey (USGS), n.d. Why do USGS earthquake magnitudes differ from those published by other agencies? available at https://www.usgs.gov/faqs/why-do-usgs-earthquake-magnitudes-differ-those-published-other-agencies. Accessed 05 Feb 2026.
Yen, M.-H., Bindi, D., Oth, A., et al. (2024). Source parameters and scaling relationships of stress drop for shallow crustal seismic events in Western Europe. J. Seismol., 28, 63–79. https://doi.org/10.1007/s10950-023-10188-y
Wen, Y.-Y., Miyake, H., Yen, Y.-T., Irikura, K., Ching, K.-E. (2014). Rupture directivity effect and stress heterogeneity of the 2013 Nantou blind-thrust earthquakes, Taiwan. Bull. Seismol. Soc. Am., 104(6), 2933–2942. https://doi.org/10.1785/0120140109
*CORRESPONDING AUTHOR: Aaron MOYA,
Laboratorio de Ingeniería Sísmica, Universidad de Costa Rica, COSTA RICA
e-mail: cesar.moya@ucr.ac.cr
© 2025 the Author(s). All rights reserved. Open Access. This article is licensed under a Creative Commons Attribution 4.0 International